Accessing Your Groove Reports
To access your Groove Reports click Reports on the top navigation. You can choose from Conversations, Productivity, Happiness and Knowledge Base.
NOTE** Reports can be viewed by inbox or as a whole.
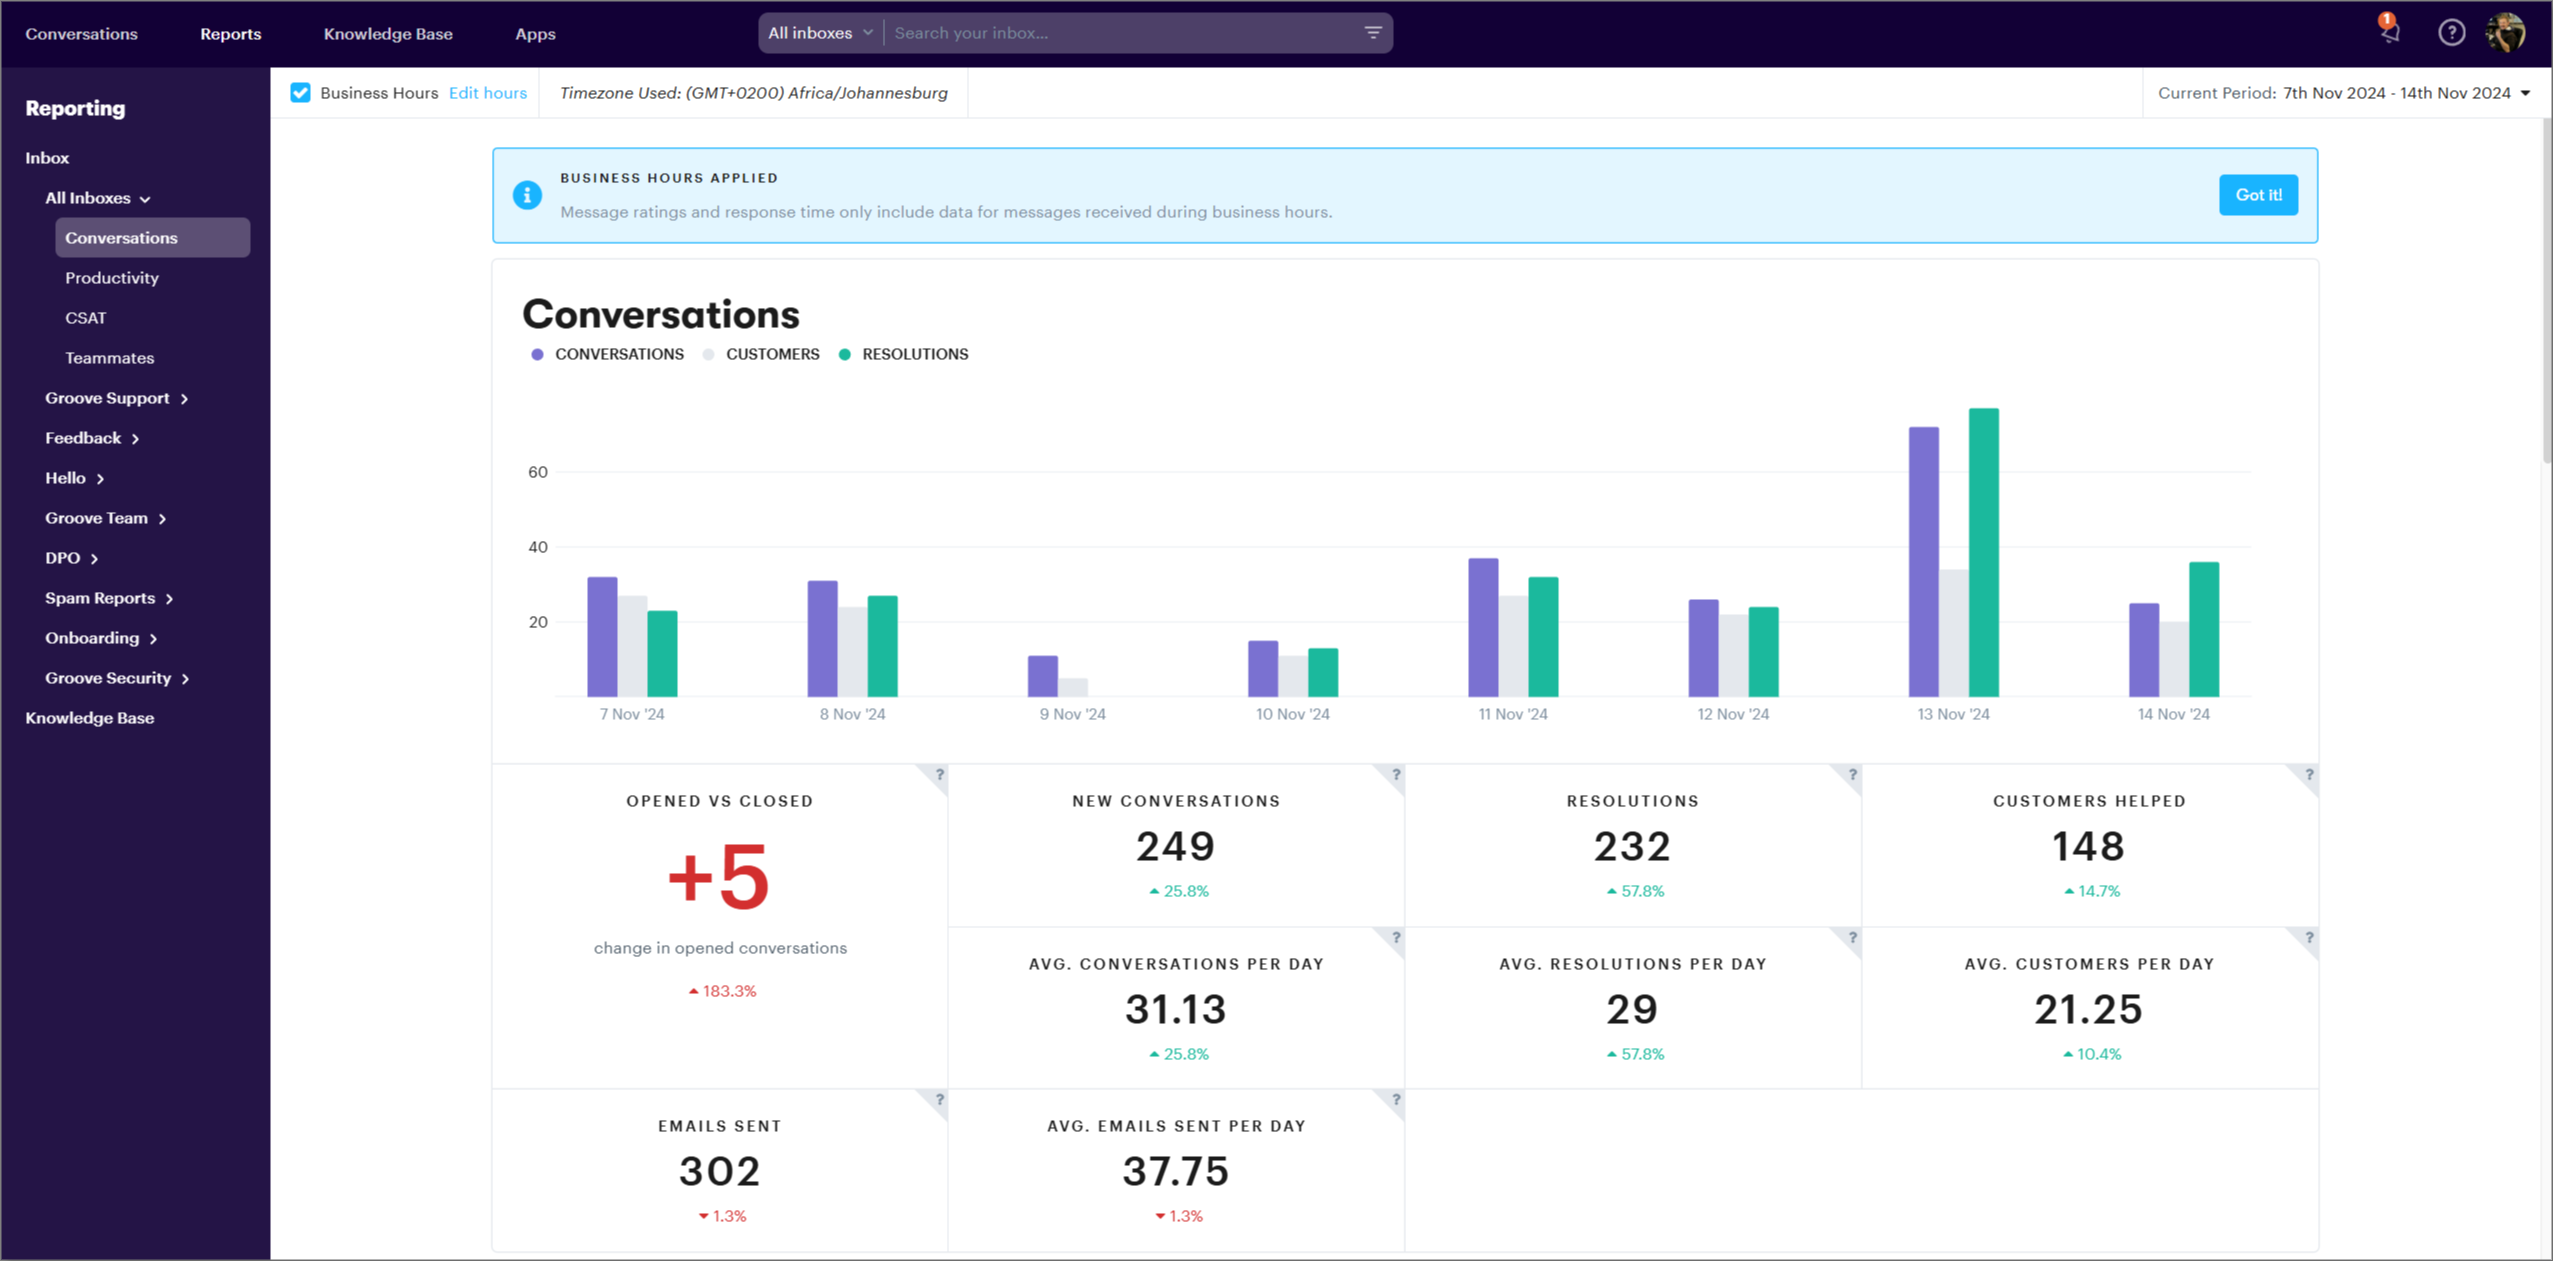
Conversation Reports
The Conversation Report displays stats about your support volume and the types of conversations you're handling (what's coming in and going out). You can hover over the ? and see exactly what data the report is measuring.
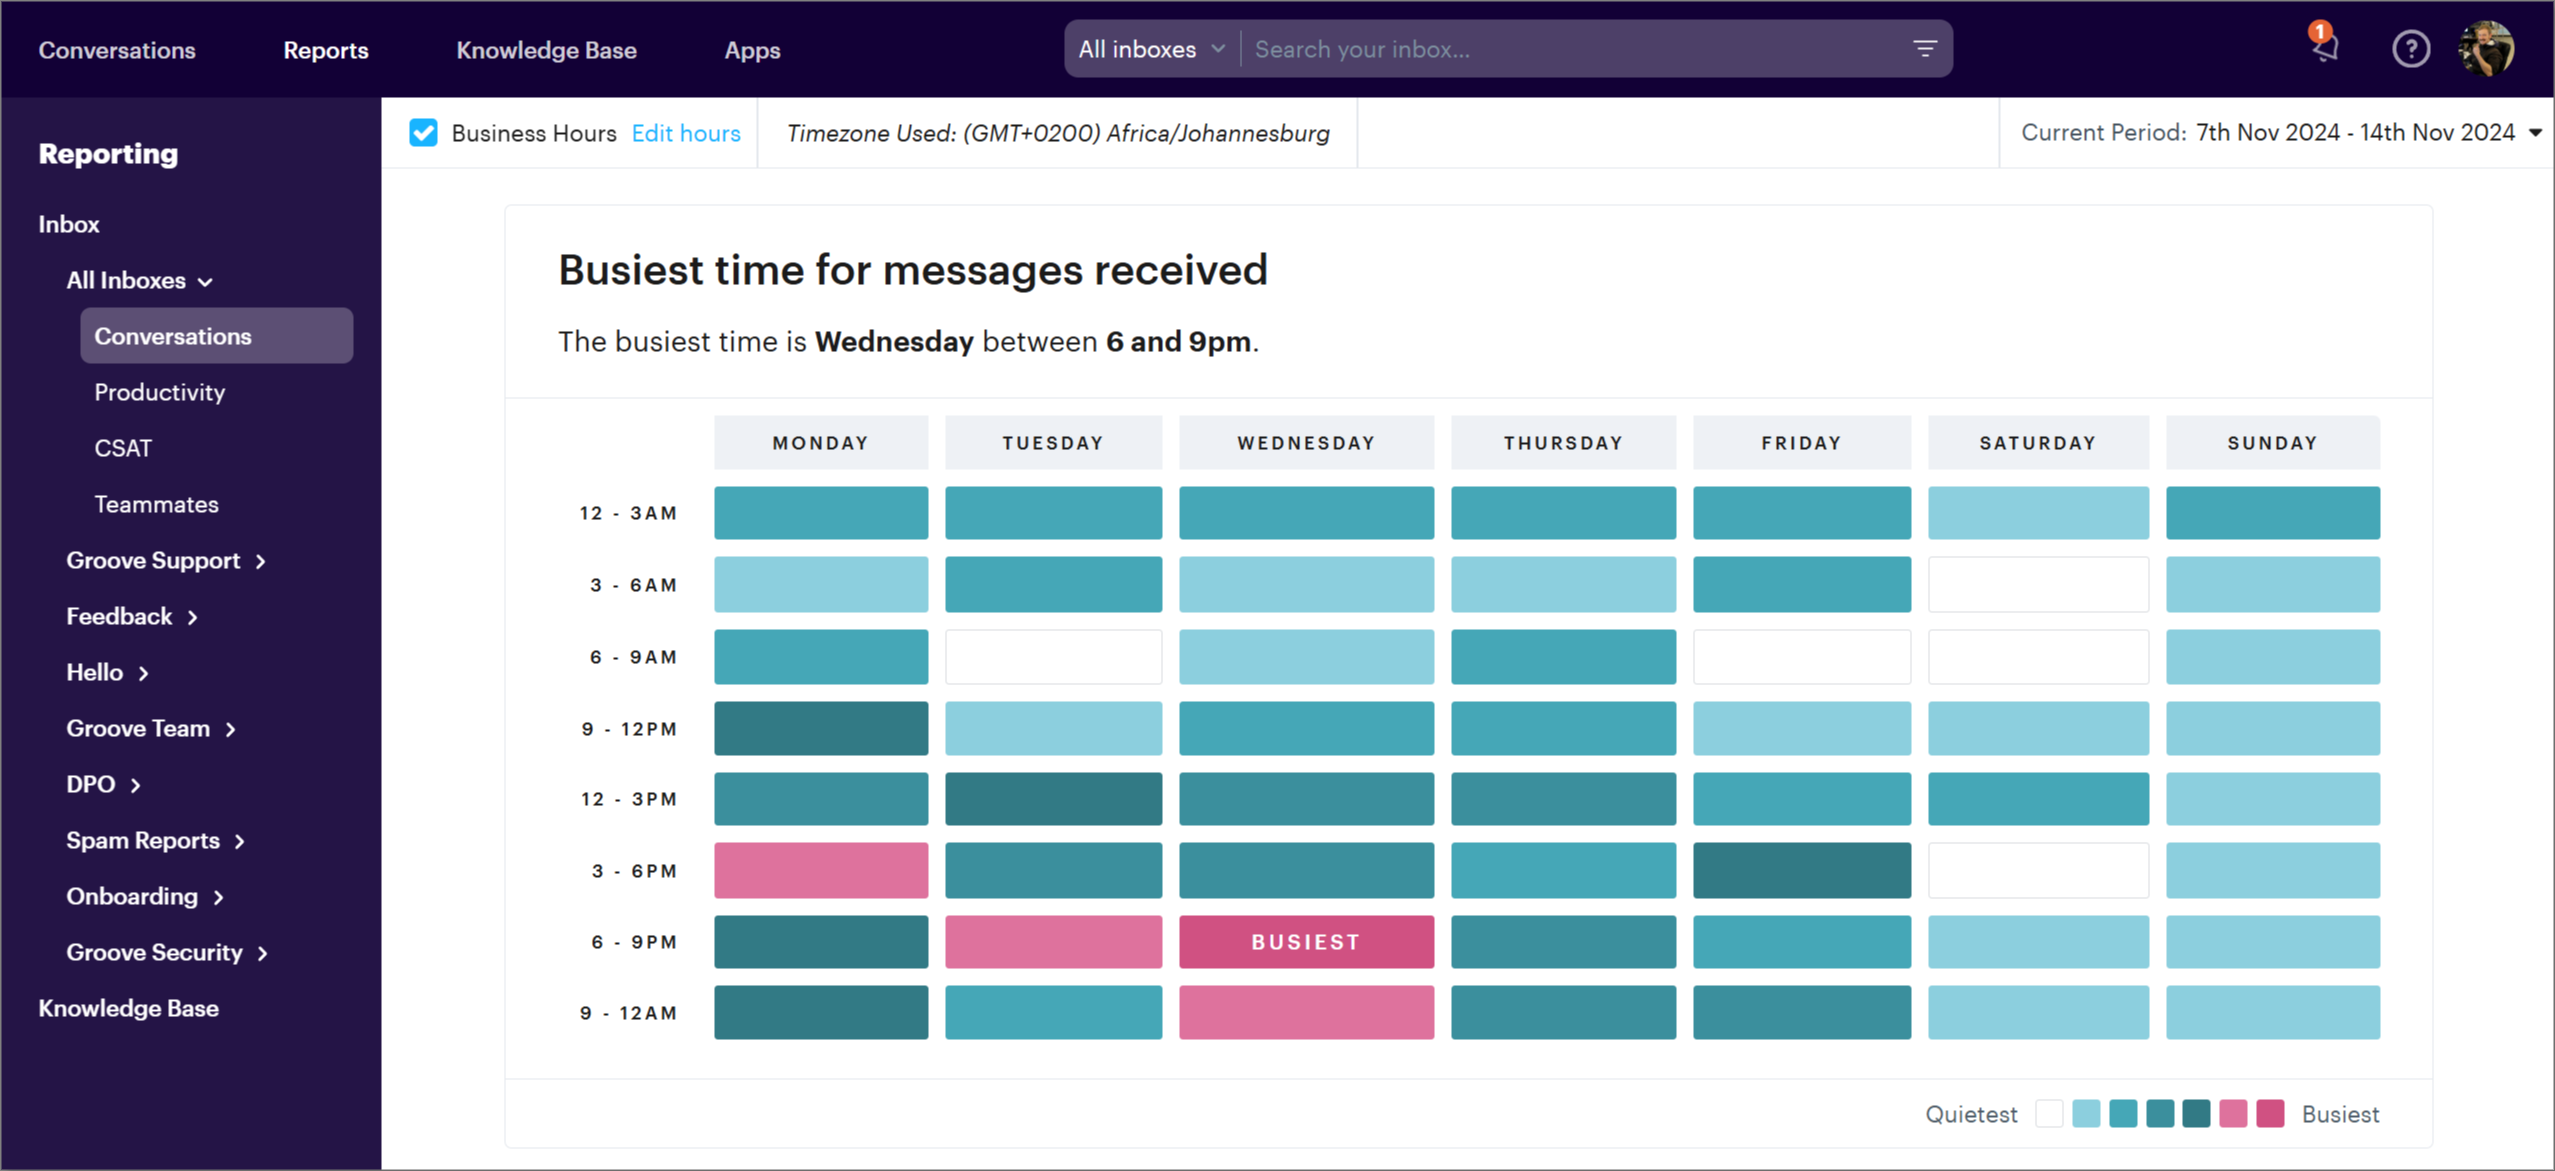
Scroll down and see your Busiest Times for incoming messages so you know how to schedule your support team and can plan meetings around it. The teal color indicates slower times while the magenta indicates busy times of the day. The times shown use the time of your browser (local to where you are).
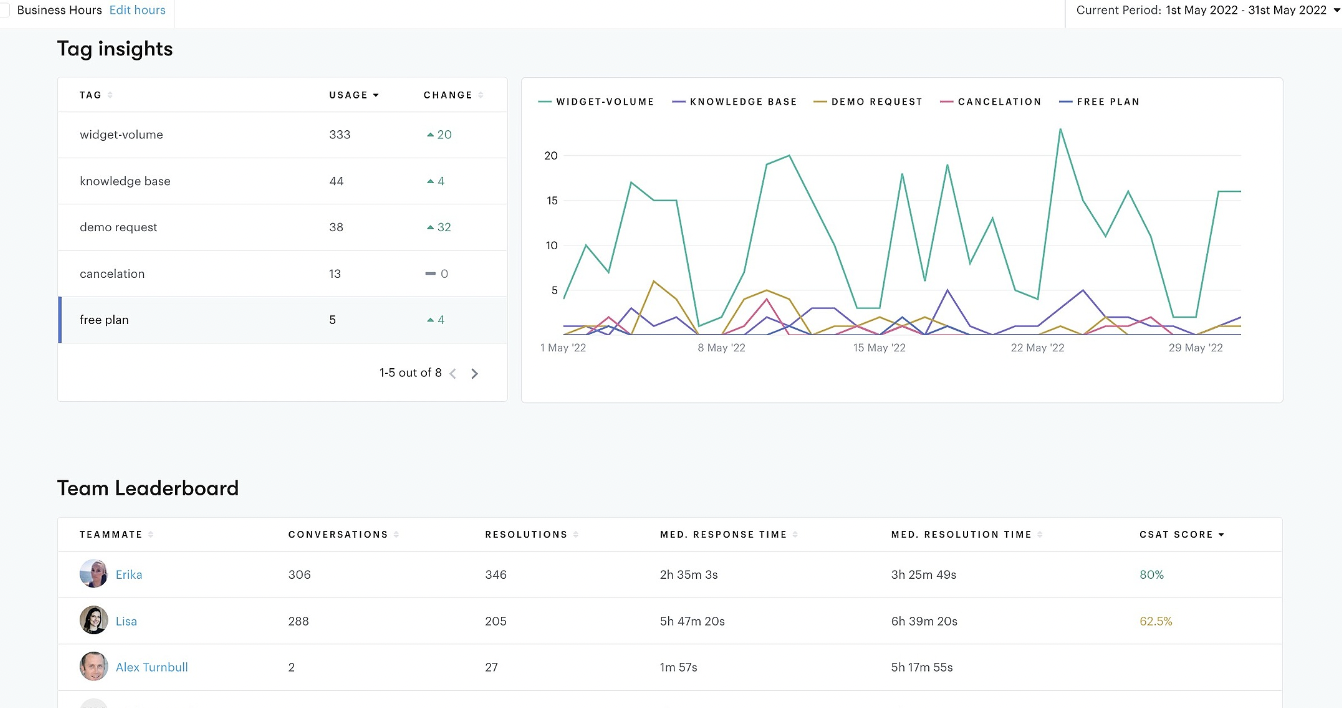
Continue scrolling to see the Tag Insights report which show you how many times a tag was used in the selected time period. This is super useful for understanding conversation trends. Just below that is your Team Leaderboard, which can be used to understand team members' individual performance.
Read more about How the Conversation Reports are Calculated.
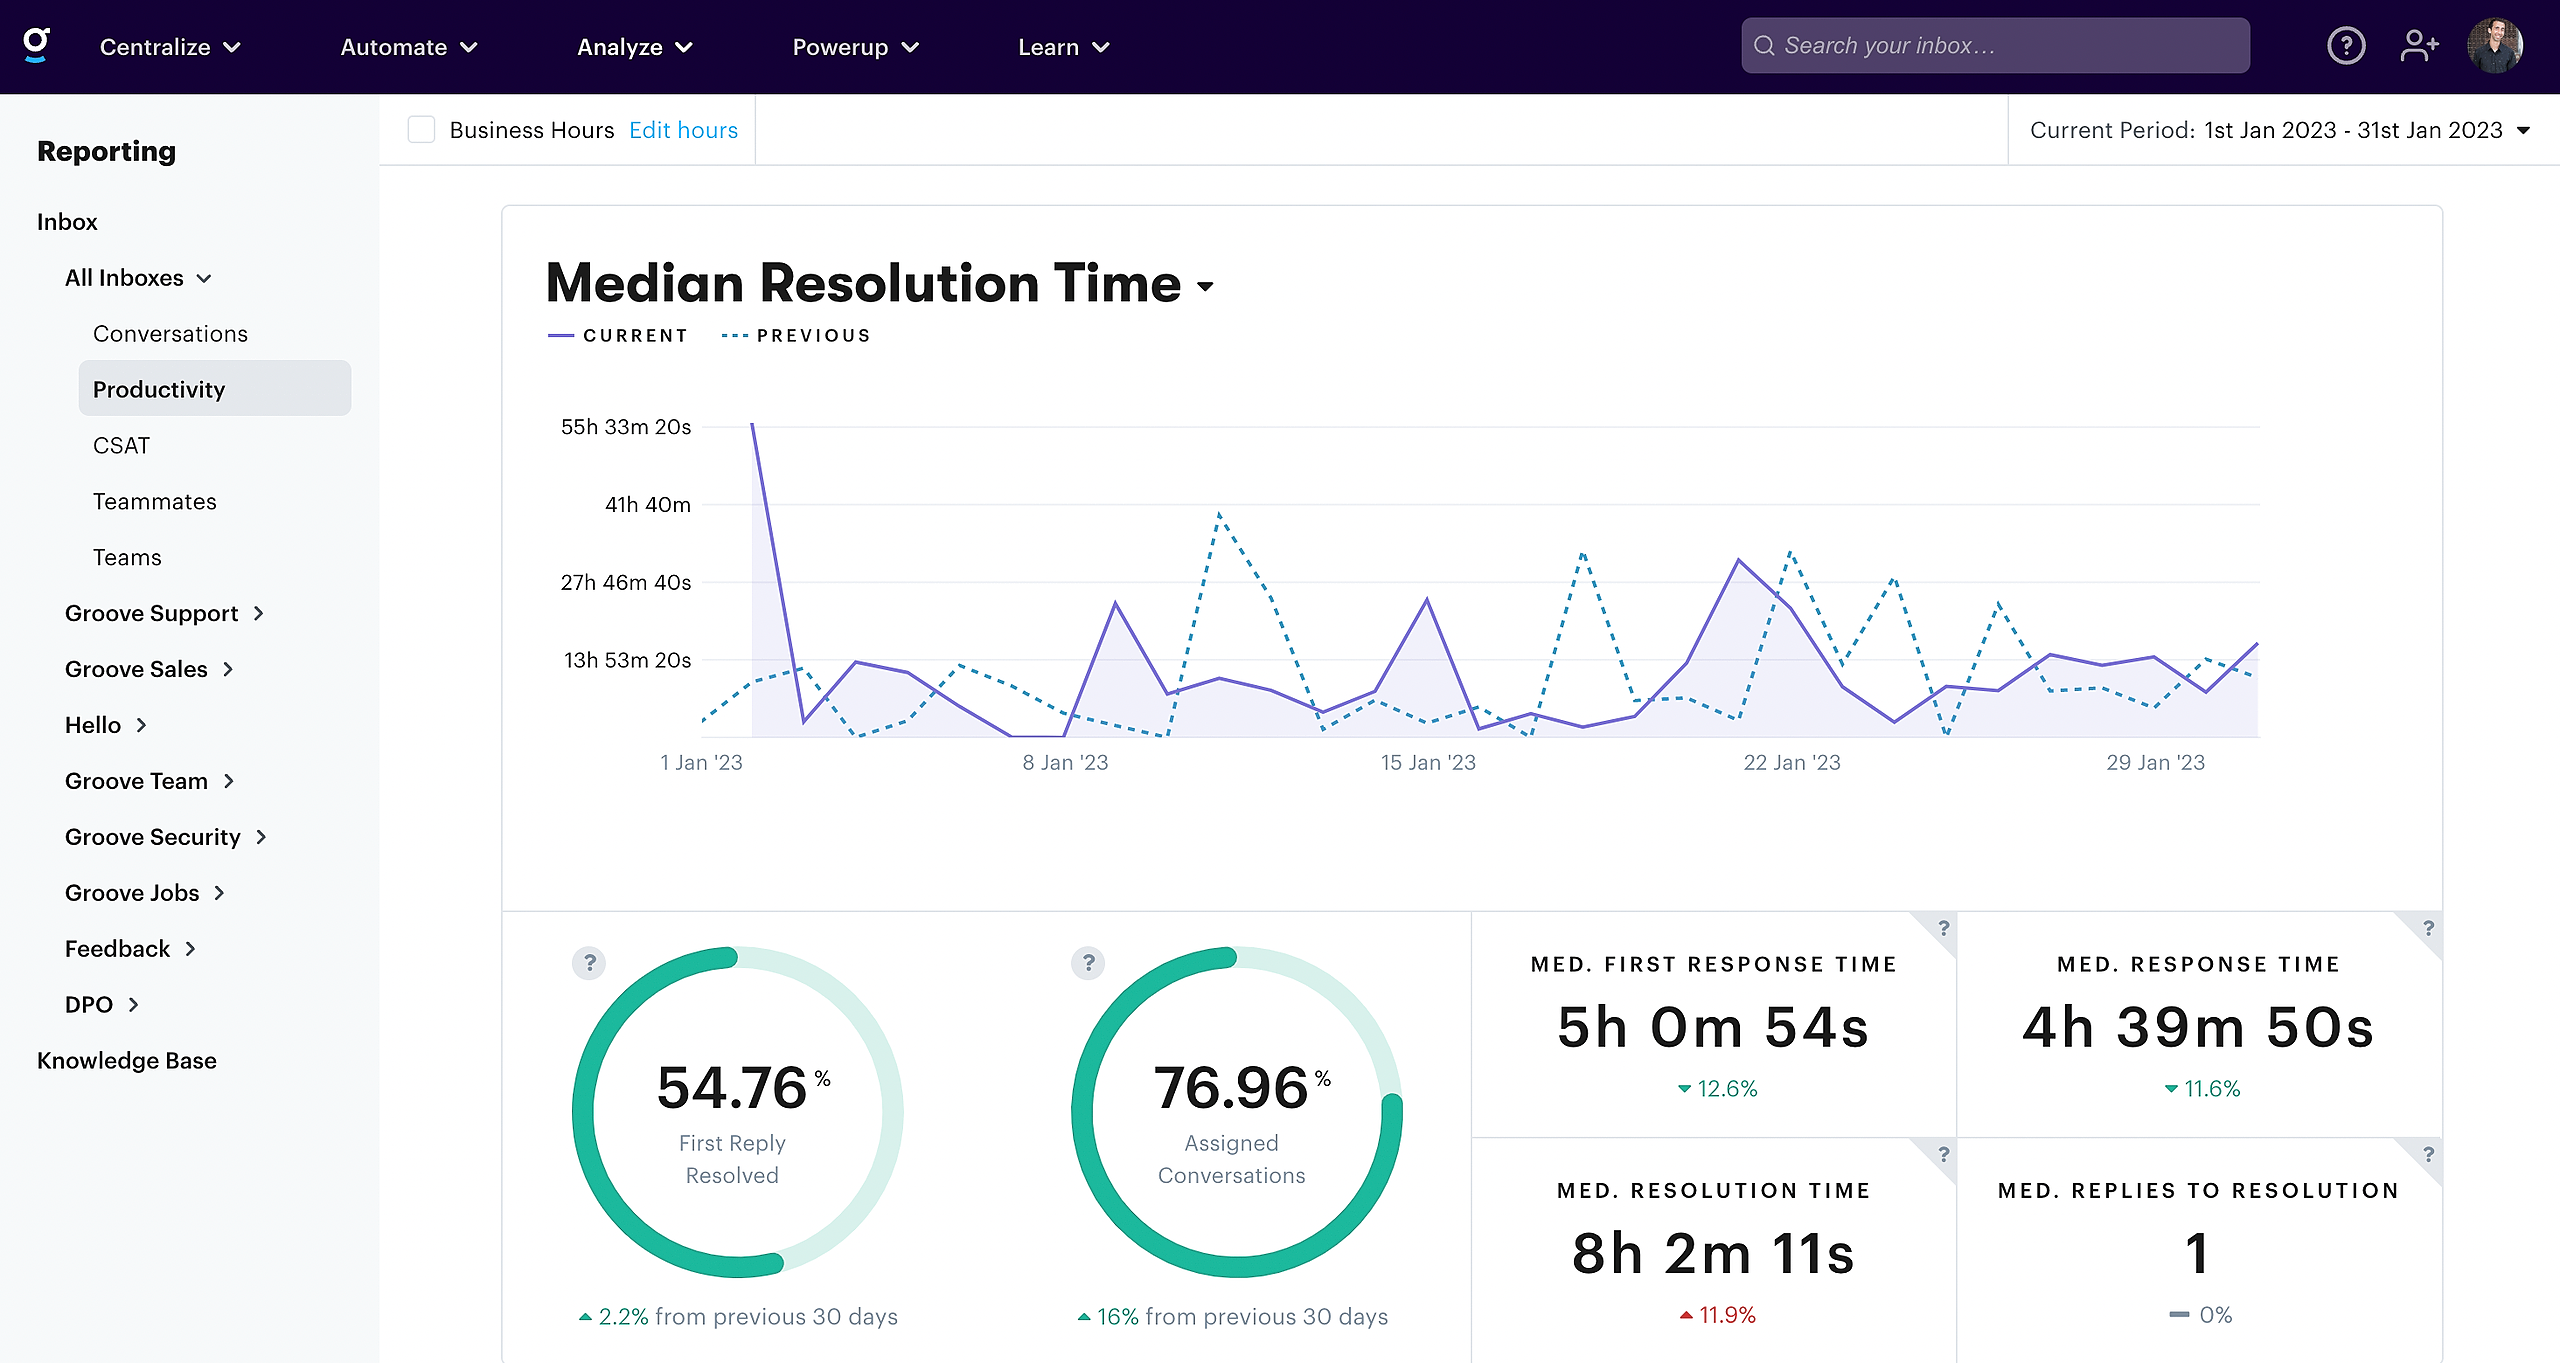
Productivity Report
The Productivity Report depicts your overall support performance, looking at efficiencies for response time and resolutions.
Read more about How the Productivity Reports are Calculated.
Happiness Reports
The Happiness Report is where you can see the details for your Customer Satisfaction Ratings. In order for this report section to populate, you do need to activate the CSAT tool in Groove and your customers will need to leave feedback for you.
Read more about How the Happiness Reports are Calculated.
Teammates Report
The Teammate Report is where you can explore your individual agent workload and performance.
On the overview page you get a snapshot of how your agents are doing and breakdown into their individual activity. When you click on teammate you're taken to their overview page that contains stats for the agent's performance and a list of recently rated conversations.
Read more about How the Agent and Team Reports are Calculated.
Knowledge Base Reports
When you have a knowledge base installed for your account, this section will appear at the bottom of your reports. This allows you to understand the performance of your KB and what's important to your customers.
The metrics included are for:
Total visits
Total visitors
Total articles viewed
Average time spent on article
Percentage of users who performed a search
Percentage of users who viewed an article
Scroll down the page to see a list of your most popular articles, top searches, and a list of failed searches.
This is the test text i have added. Okay great.