When you have the Customer Satisfaction Ratings added to your Groove account, you can see stats around these ratings in your reports dashboard.
Overview
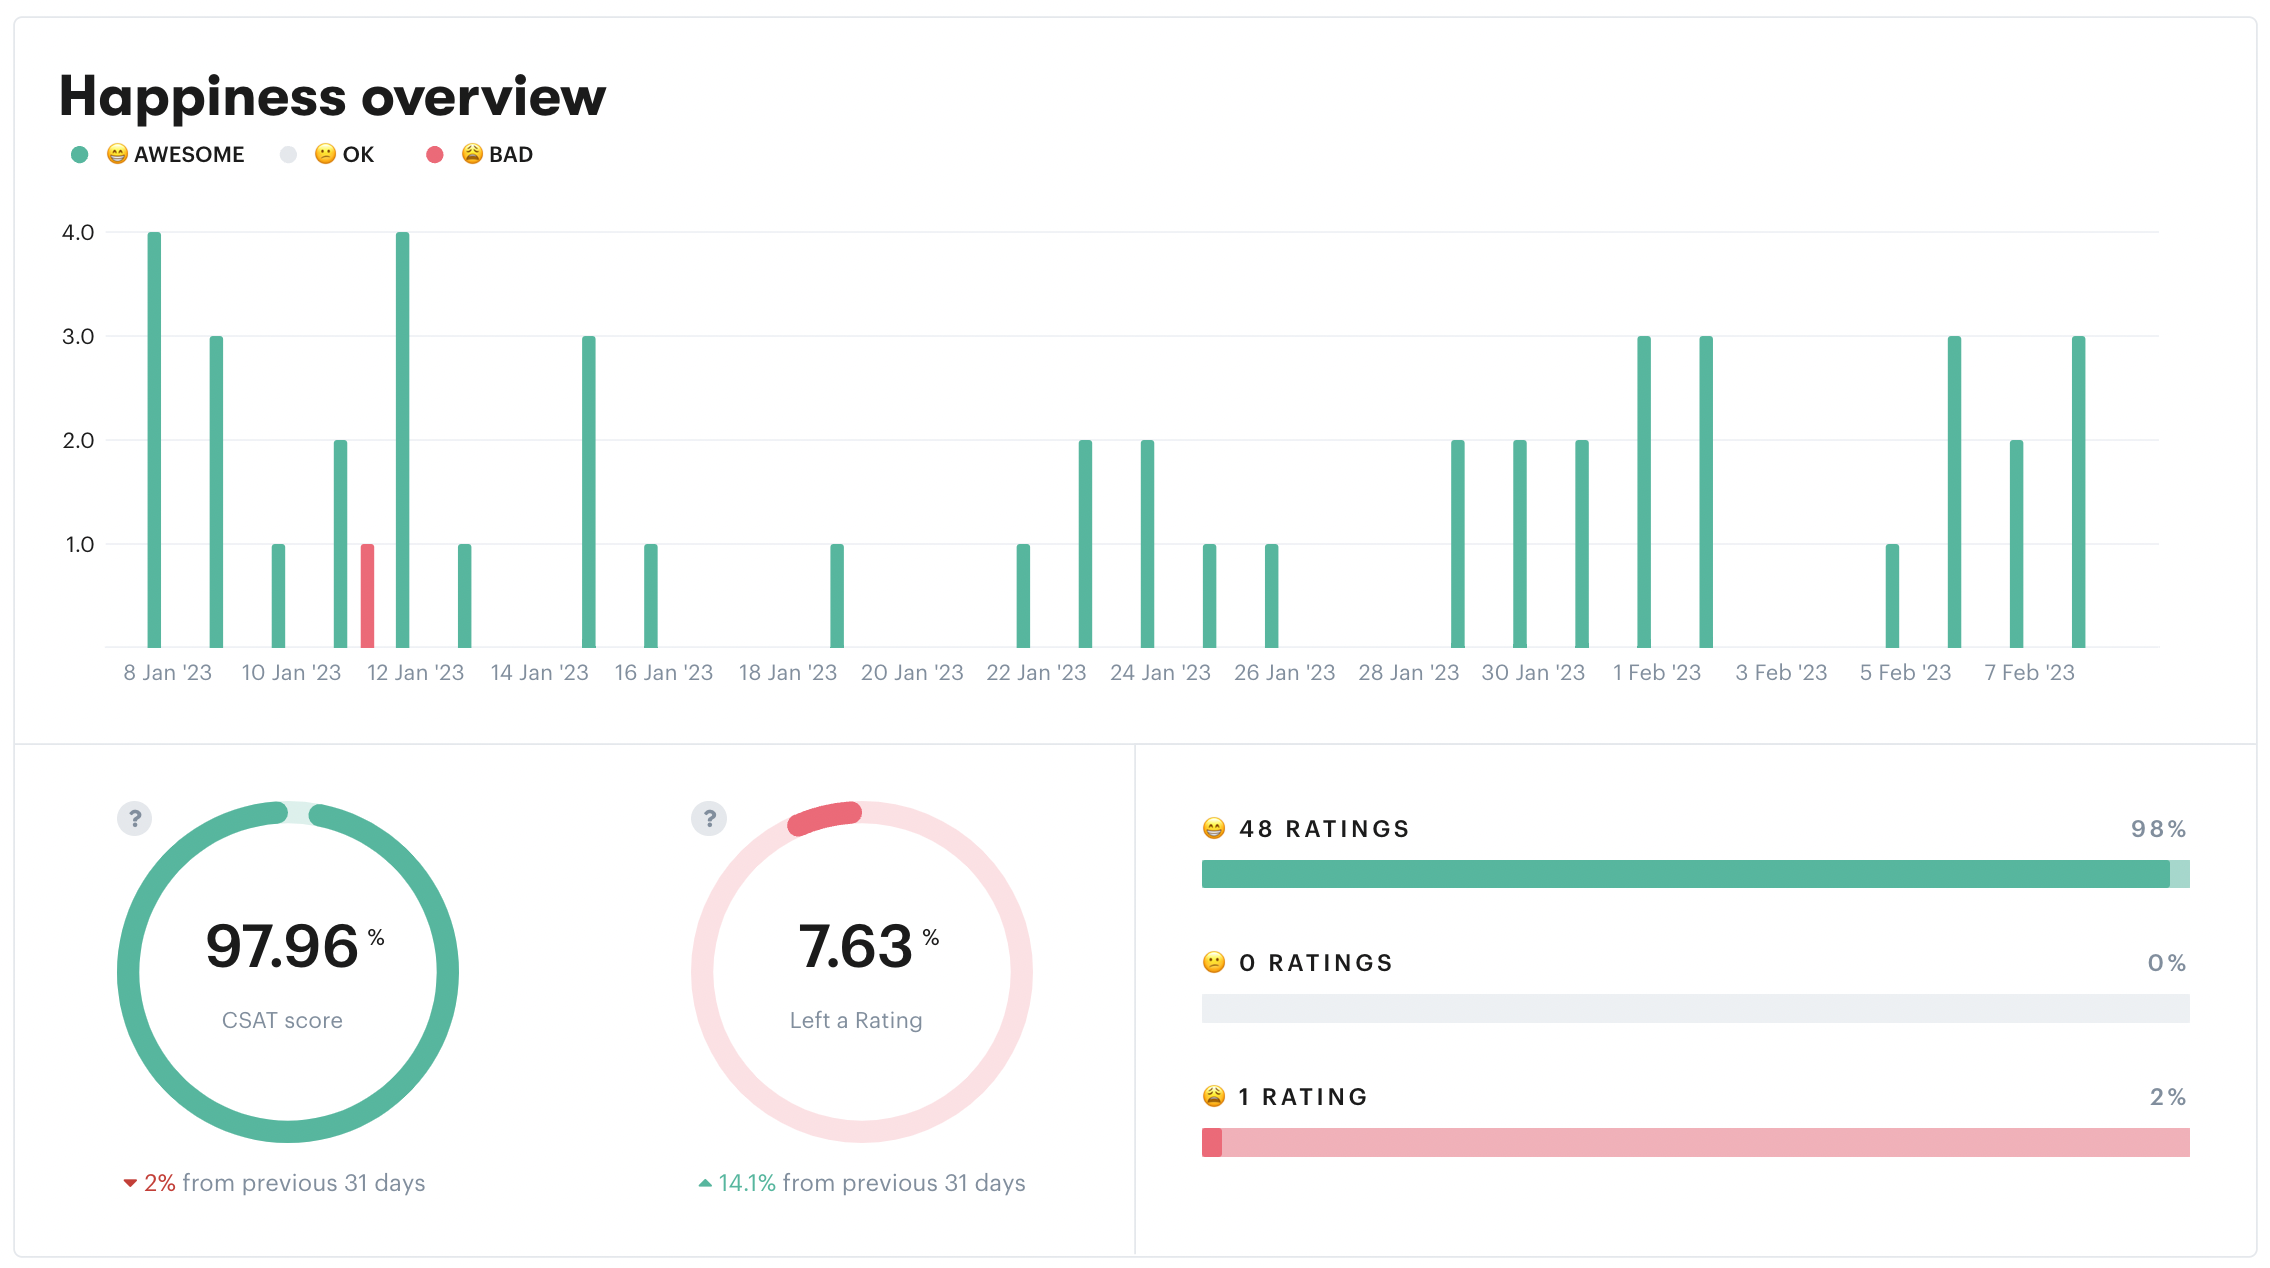
The overview contains the total number of the various ratings (Awesome, OK, Bad) for each day in the currently selected time period.
Happiness Score
CSAT score is calculated as the total number of Awesome ratings divided by the total number of ratings within the currently selected time period.
Left a Rating
The percentage of customers that were sent a reply and left a rating. That is the total number of customers that created a rating within the currently selected time period divided by the total number of customers that were sent a message within the currently selected time period.
Total Ratings Counts
These progress bars show the total number of each rating type for the currently selected time period and what percentage it is of the total number of ratings.
Recent Ratings
Ratings that were received recently and some additional details for their respective conversations. Note that this table ignores the currently selected time period.