To find your Productivity report head to Reports → Productivity.
Some important definitions to note as far as reports are concerned:
Conversations = tickets
Resolutions = conversations that are marked as closed (with or without a reply)
Customer = each unique email address/contact who sends you a message
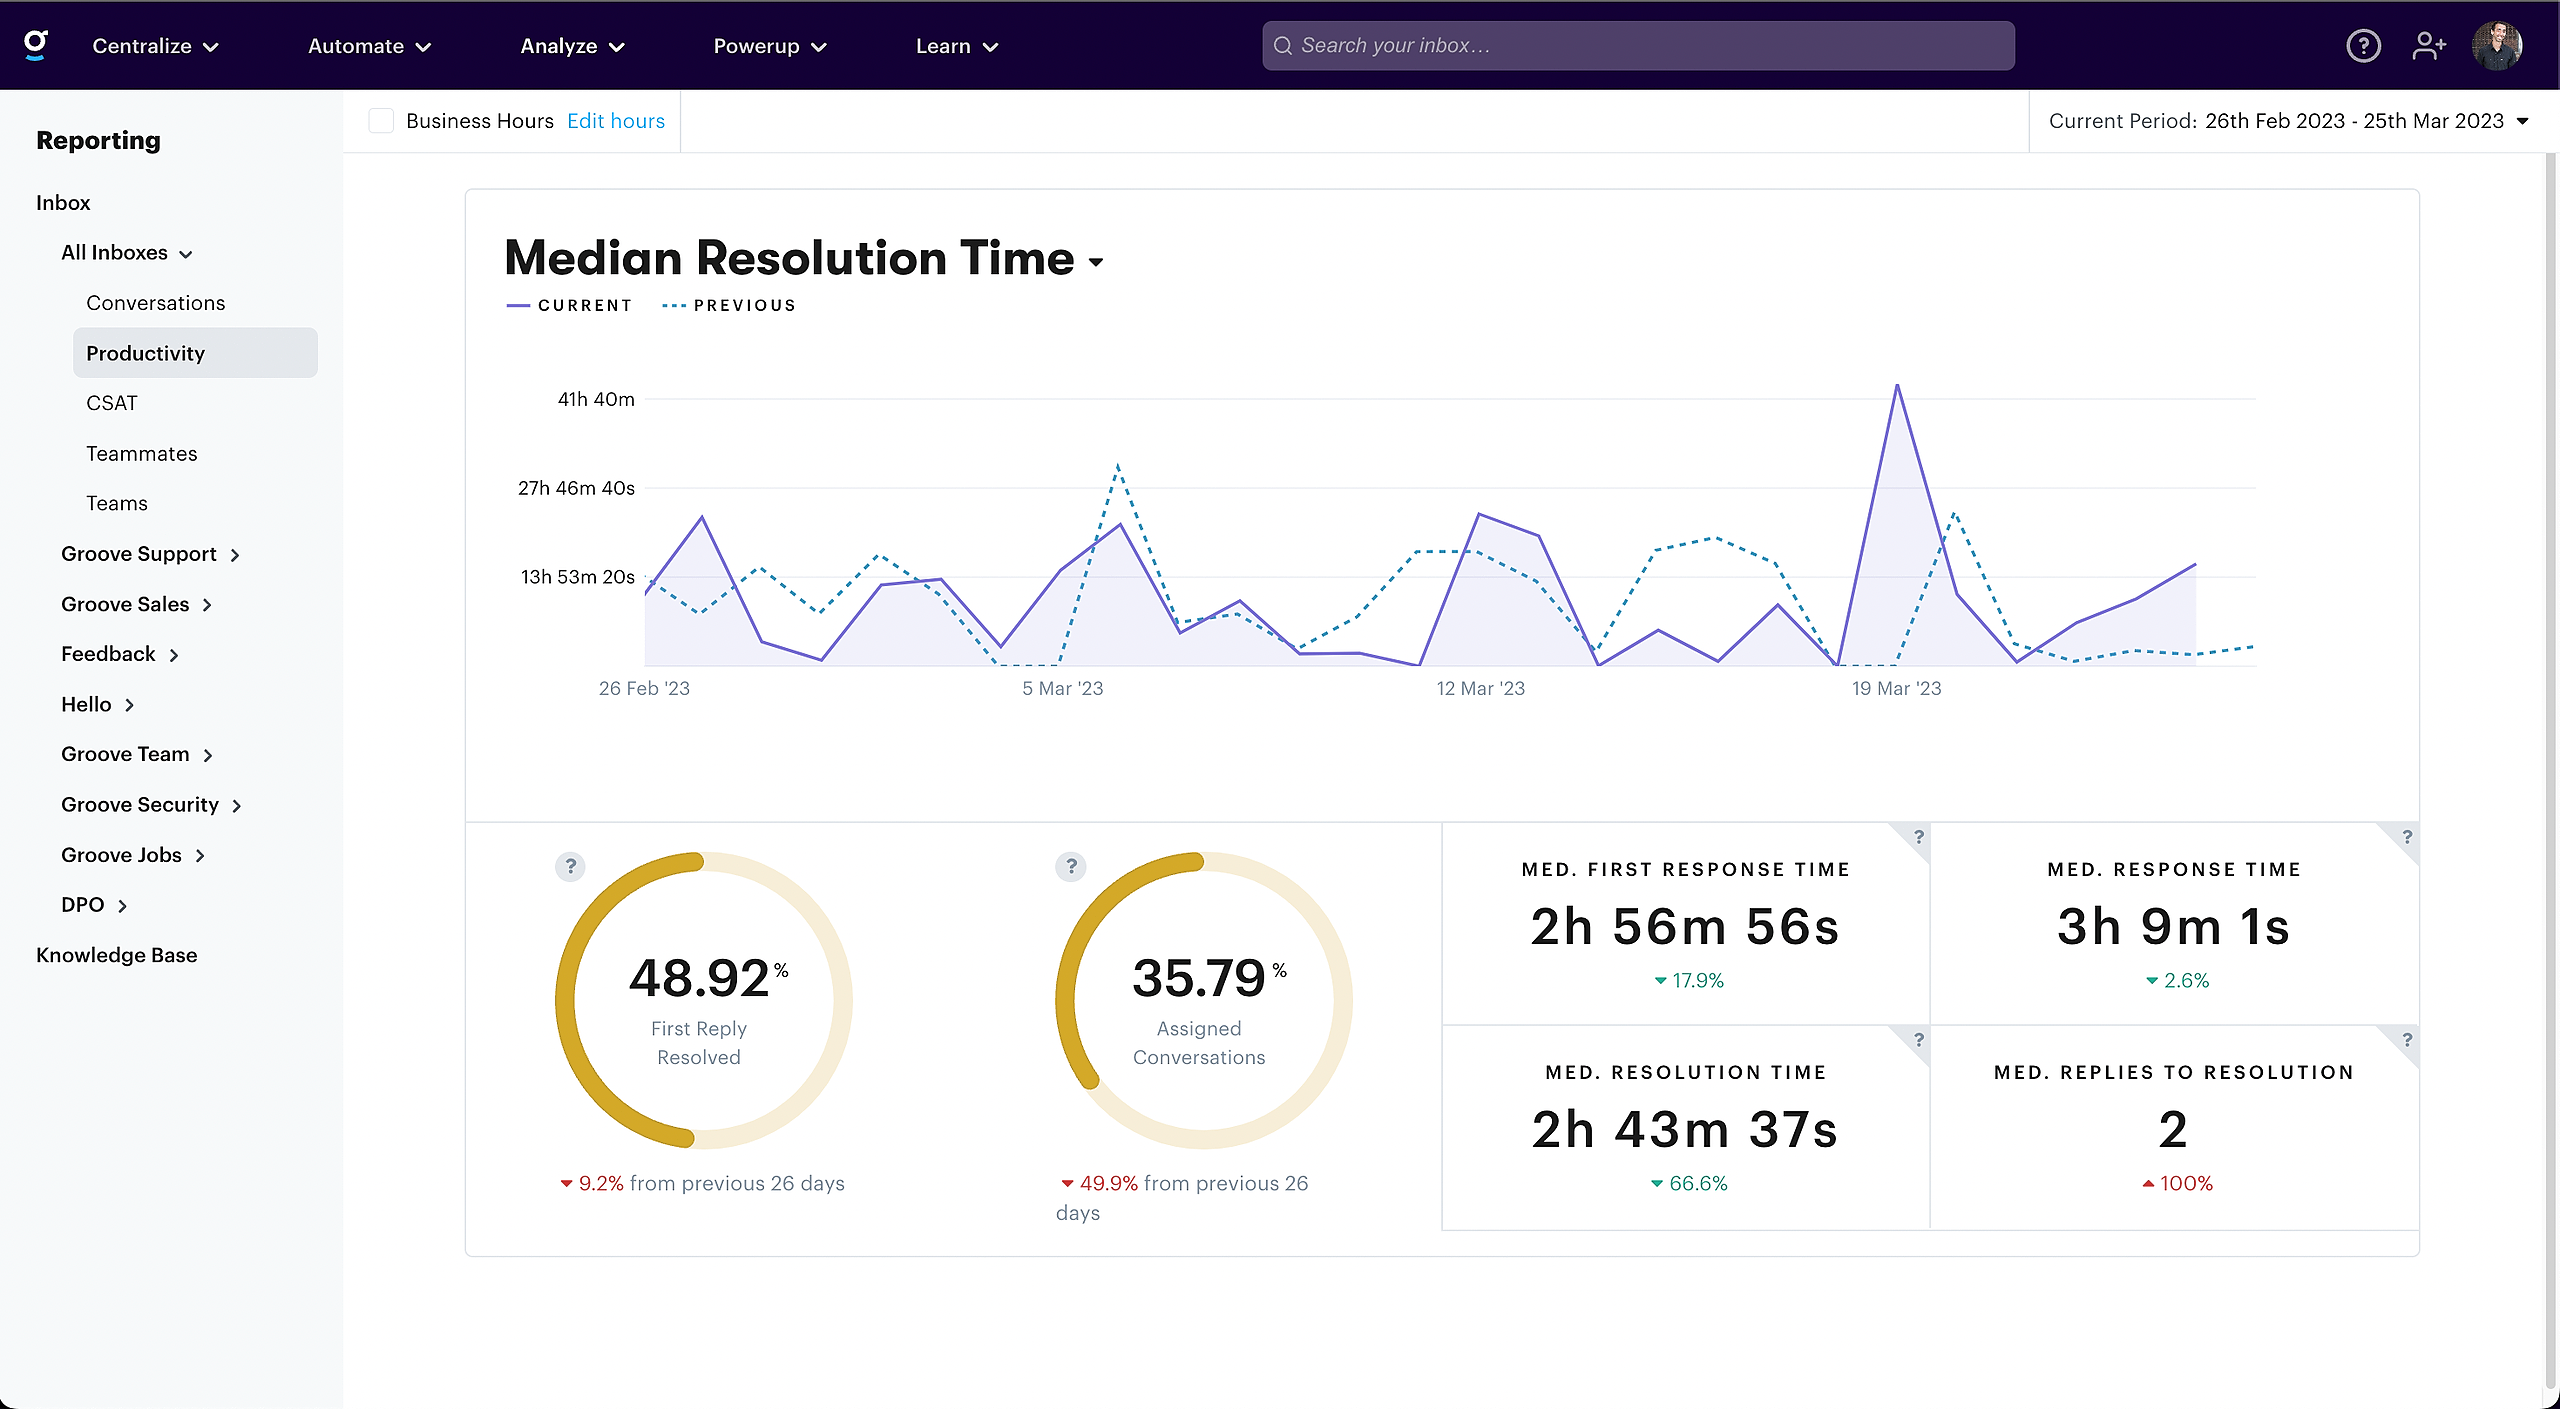
Productivity Stats
First Reply Resolved
The percentage of resolved conversations that were resolved with a single response. That is the number of resolved conversations with a single reply divided by the number of resolved conversations with one or more responses.
Assigned Conversations
The number of conversations assigned in the currently selected time period divided by the number of conversations created in the currently selected time period. Note the first is not necessary a subset of the second, so it is not the percentage of conversations that were created and then assigned.
Median First Response Time
The average time between a conversation being created and the first response send by an agent.
Median Response Time
The average time it takes to reply to messages.
Median Resolution Time
The average time between a conversation being created and it being closed for the final time, excluding the time a conversation spent being snoozed.
Average Replies Per Resolution
The average number of replies sent from an agent to a customer for resolved conversations. Resolved conversations with less than one reply will not be included in this calculation.
Understanding the Line Graph
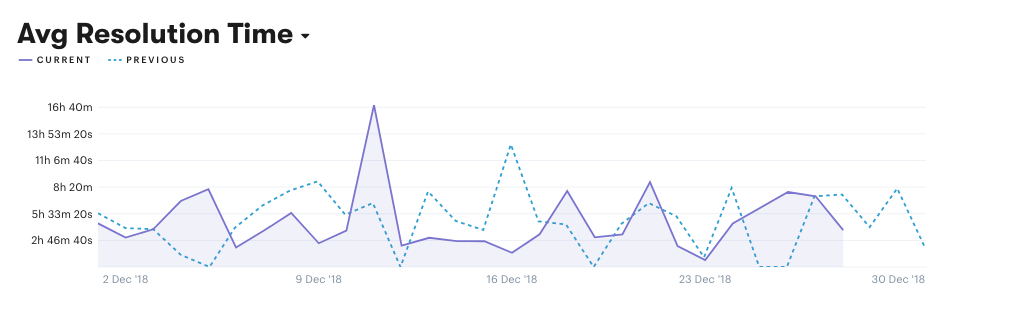
Average Resolution Time
The day the conversation was closed is the day that the value is included on the x axis.
Average First Response Time
The day the response was sent is the day that the value is included on the x axis.
To change the productivity metric shown in the graph, click on the title and then select from the dropdown menu.